Time Series
<TimeSeries>
 ZopraCharts
By field
Every field has its own favourite charts, usually invented by someone who was tired of the previous one. Pick your field and start with the ones your colleagues will already recognise.
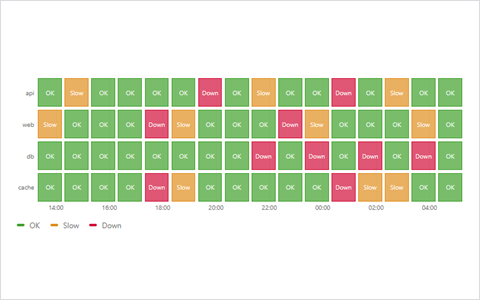
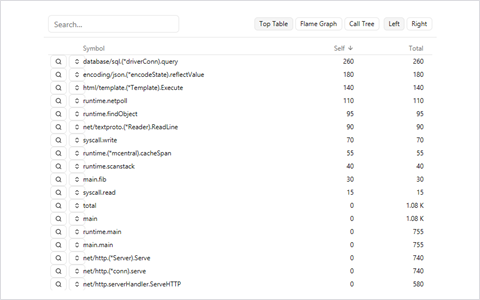
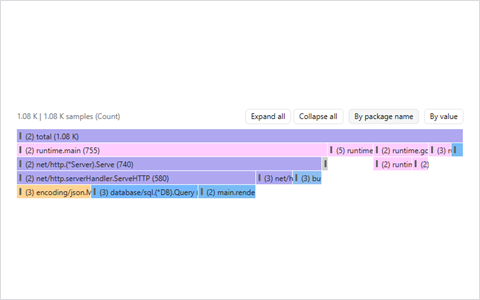
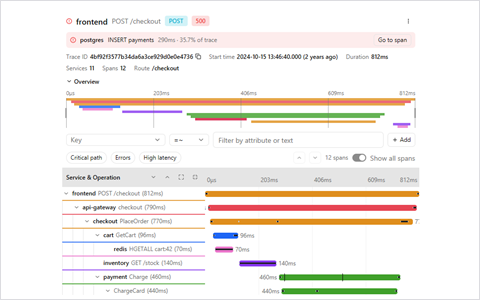
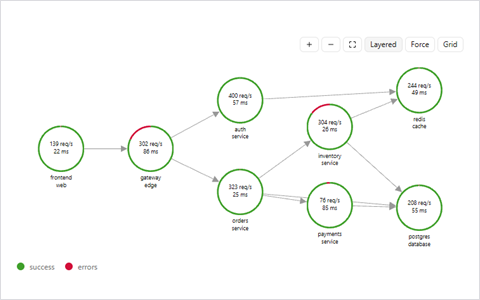
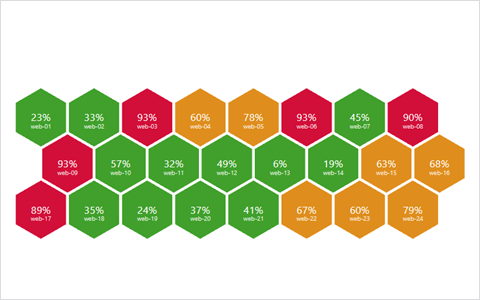
You run something that has to stay up, and you want to see what it is doing right now and what it did at 3 a.m.
Prices, returns, risk and the quarterly meeting where someone asks why the number moved.
Process control, defects and finding the one machine that is quietly ruining your Tuesday.
Funnels, journeys, segments and the slow realisation that nobody reads the dashboard.
Distributions, agreement between methods, effect sizes and honest uncertainty.
Waveforms, spectra, links that must stay open, and loops that must stay stable.
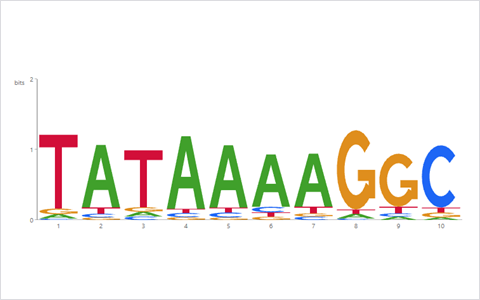
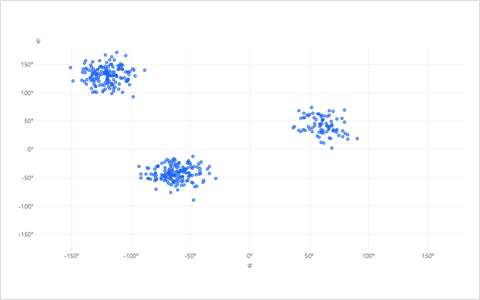
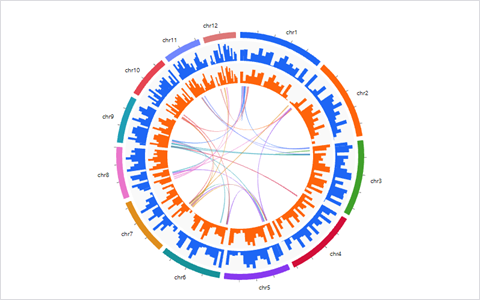
Genomes, protein shapes, conserved letters and the chemistry of water.
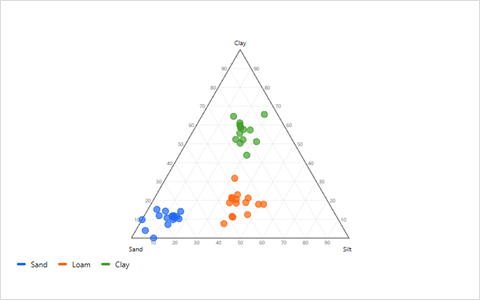
Soundings, rocks, groundwater and maps where the colours stand for something.
Stars, orbits, chaos and what happens when you nudge a system and watch.
Who depends on whom, what is the plan and where do the arrows cross.